Granular, Spectral & Pitch · Utility
Scope
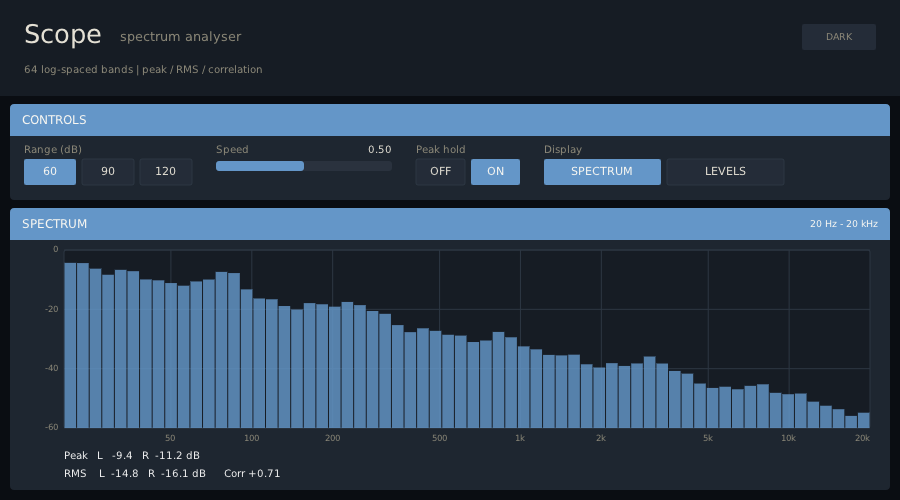
A spectrum analyser and level meter that passes audio through untouched. 64 log-spaced bands from 20 Hz to 20 kHz with a labelled grid, or per-channel peak and RMS meters plus a correlation readout.
Opinion
A window on the signal, not a processor. Audio runs straight through, so it can sit at the end of a chain without changing what you hear, and it reports what it sees both on the panel and as host-visible parameters (peak, RMS, correlation and all 64 bands), which means you can automate or record the analysis as well as look at it.
The Spectrum view is built for music rather than for measurement: 64 bands spaced logarithmically from 20 Hz to 20 kHz, each taking the loudest bin inside it, so a narrow partial or a whistle stays visible instead of being averaged away. A labelled frequency grid and a 60/90/120 dB scale make it quick to read. The Levels view swaps the spectrum for per-channel peak and RMS bars and a correlation meter — handy for spotting a phase problem in a stereo pair, where a correlation that sits below zero means the channels are fighting.
It is a compact display, not a metering suite: no loudness (EBU R128), no goniometer, no K-metering, and the spectrum is a mono sum of the two channels rather than a per-channel pair.
Functionality
A 2048-point FFT every 512 samples on the mono sum, square-root Hann windowed with a normalisation that makes a full-scale sine read 0 dBFS. Bin magnitudes are smoothed by Speed (0.01-0.25 per frame), then collapsed into 64 log bands (each the maximum of its bins) so peaks survive at any frequency. Range sets the displayed floor at 60, 90 or 120 dB. Peak hold leaves markers at the highest level seen. Levels mode shows peak (with a slow 0.9995 release), RMS (one-pole, 0.002-0.022 by Speed) and correlation (exponential over about 1 000 samples) per channel.
The analysis outputs are ordinary parameters, so a host records and automates them:
peak_l, peak_r, rms_l, rms_r, corr and spec_00 … spec_63, all read-only to the
user. No latency is introduced and no plugin state is kept.
Parameters
| Parameter | Range | Default | Notes |
|---|---|---|---|
| Range | 60, 90, 120 dB | 60 | Display floor |
| Speed | 0-100 % | 50 | Analyser and meter ballistics |
| Peak hold | off, on | on | Markers on both displays |
| Mode | Spectrum, Levels | Spectrum | |
| Peak L/R, RMS L/R | output, dB | -120 | Read-only analysis |
| Correlation | output, -1 to 1 | 0 | Read-only |
| Band 00-63 | output, dB | -120 | Read-only, log-spaced |
Origin
Its own design. The band layout (20 Hz-20 kHz, 64 bands, log spaced) and the dB normalisation follow the usual analyser conventions rather than any particular product.
Status
Core DSP, the VST3 target, the catalogue screenshot and a 20-check core suite are complete. The pass-through was measured in the JACK standalone (a half-scale 1 kHz sine in, -6.02 dBFS peak and -9.03 dBFS RMS out through the plugin). Open: the grid is a fixed 20 Hz-20 kHz axis, so at sample rates below 40 kHz the top band is the Nyquist frequency while the axis still reads 20 kHz; nothing has been run in a host yet.